Monitoring Kubernetes with Elasticsearch, Kibana, and Heapster
18 Sep 2017I’ve been doing a lot of application monitoring and performance optimization at work. My newest toys are Elasticsearch and Kibana - we decided to take a look at them for log aggregation and visualization. Getting these tools to integrate with our Kubernetes-based applications was a bit of a journey.
At AerisWeather, we recently took the plunge into using Kubernetes to orchestrate containers for a number of our web and data-ingest services. While we have been generally pleased with the experience, we have found metrics, monitoring, and logging to be major pain points for us. Kubernetes provides no out-of-the-box system for centralized logging, so we had resorted to scanning log files on individual pods with a lot of guess-and-check work in matching server logs to application behavior. Without any human-readable interface for viewing application metrics, it was really hard to construct a story describing why an application behaved the way it did.
It was clear that we needed a better solution, one that could aggregate log data across many different services and display the data in a way that is actionable. So we started with making a list of things we wanted to know:
- Metrics per pod and service (CPU, memory usage, latency, application errors) so we can identify and correct misbehaving applications
- Scheduling behavior – which nodes are the pods put on, and are we scheduling optimally?
- Resource allocation vs actual usage so we can right-size our resource limits
Some of this information is available with the Kubernetes dashboard add-on, but the data only displays for a short period of time, and the dashboard UI doesn’t provide the level of customization we need to get real insight into our application behavior.
The Elastic Stack
After spending some time looking into available monitoring solutions, it quickly became clear that some version of the Elastic Stack is the way to go for us. It’s very well-documented with broad community support and an advanced feature set. Plus, pricing for the hosted service is very reasonable, which means I don’t have to worry about maintaining the stack itself.
The only downside was that we had no idea how to get Kubernetes application metrics into Elasticsearch. I was really overwhelmed trying to answer this question. There are so many different tools that were unfamiliar to me — Elasticsearch, Kibana, Logstash, Beats, cAdvisor, Fluentd, Heapster, Kubernetes internals. I didn’t know where to start.
Finally, I ran into some documentation about an Elasticsearch “sink” for Heapster. This was the magic bullet I needed to get started.
Ingesting Heapster metrics into Elasticsearch
If you’re unfamiliar with Heapster, as I was, it’s a tool that collects metrics from Kubernetes and ingests them into any number of backends (“sinks”).
You may already have Heapster running on your Kubernetes cluster. An easy way to check is to run:
$ kubectl get pods --all-namespaces | grep heapster
If you see some output, it’s already installed. If not, you can install it with an addon maintained by Kops:
$ kubectl create -f https://raw.githubusercontent.com/kubernetes/kops/master/addons/monitoring-standalone/v1.6.0.yaml
All we need to do now is configure Heapster to use the Elasicsearch sink. To do this, we need to modify the Heapster deployment:
$ kubectl edit deployment heapster --namespace=kube-system
This will open up an editor with the Heapster deployment configuration. Find a line that looks like:
spec:
    containers:
      -
        command:
        -  /heapster
        -  --source=kubernetes.summary_api:''
Assuming you have an Elasticsearch server up an running, all you need to do is add a flag for the new sink:
- --sink=elasticsearch:?nodes=https://[DB_HOST]:9243&esUserName=[DB_USER]&esUserSecret=[DB_PASS]&sniff=false&maxRetries=3
This will trigger an update of the Heapster deployment. You may want to watch the Heapster logs for a few minutes to make sure everything’s working:
$  kubectl get  pods  --all-namespaces  |  grep  heapster

kube-system heapster-3327791745-qhwgf  2/2  Running  0  5d

$  kubectl logs  -f  heapster-3327791745-qhwgf
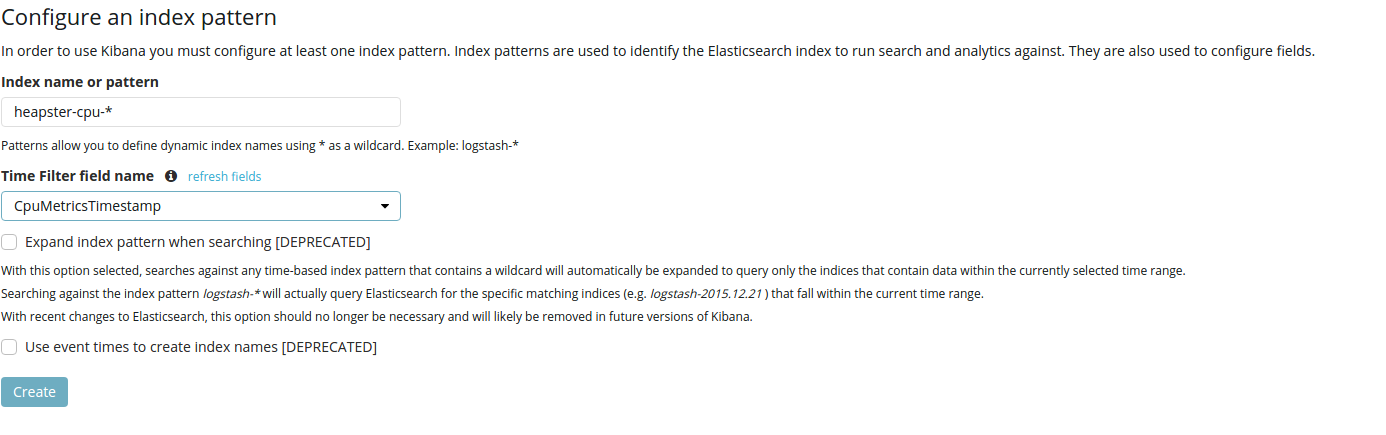
Now we just need to create an index pattern for Kibana. You can do this from the Management > Index Patterns console in Kibana.
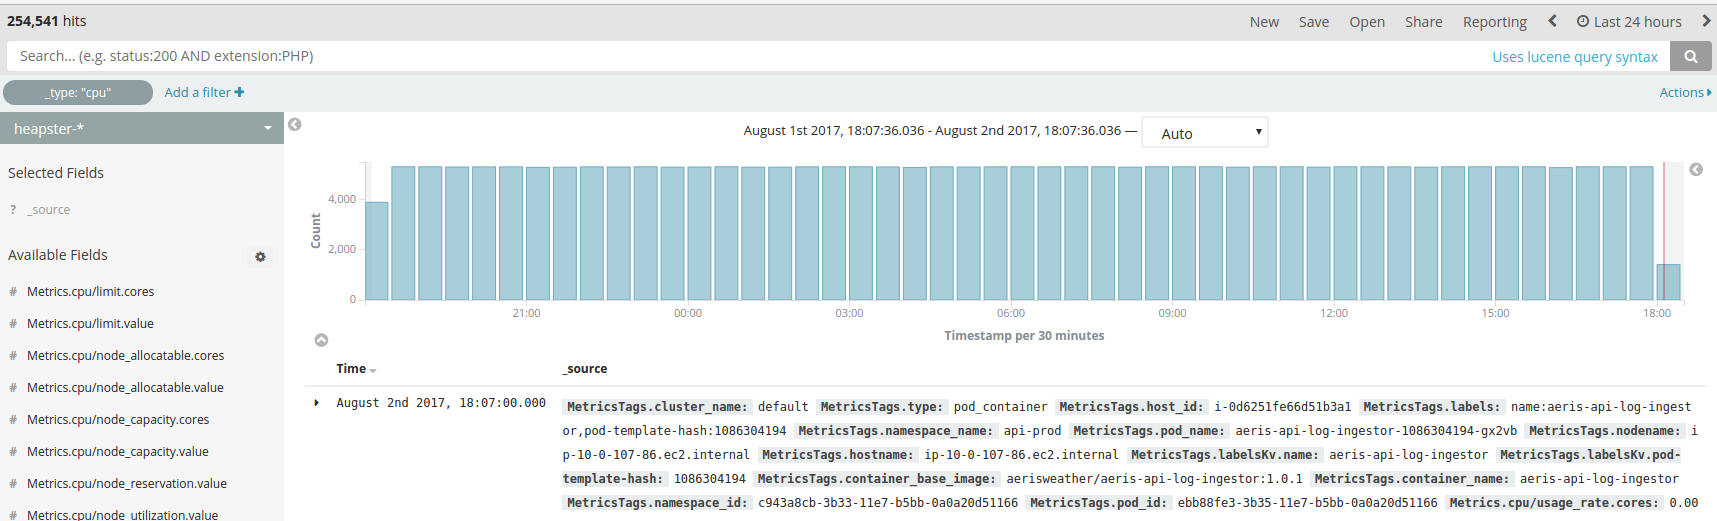
And we should start seeing logs showing up in the Discover view:
Massaging the Heapster Data
Heapster gives us a lot of really useful information out of the box. However, there are a few tweaks we’re going to want to make to the data structure, to make it easier to work with:
- Heapster uses separate timestamp fields for each metric type, which makes it difficult to visualize the data with Kibana. We’ll merge the fields into a single Timestamp field.
- Heapster logs Kubernetes labels as a single string, which makes it difficult to run queries against label values. We’ll split the labels field up separate fields for each key-value pair.
- Heapster logs memory in bytes and CPU usage in millicores. Nothing wrong with that, but sometimes it’s nice to work with larger units. We’ll add fields for memory in Gibibytes, and CPU in cores.
How are we going to do all this? Ingest pipelines to the rescue!
Take a look at the Ingest Processors documentation, or if you’re lazy, you can use the pipeline I’ve prepared: heapster-pipelines.json
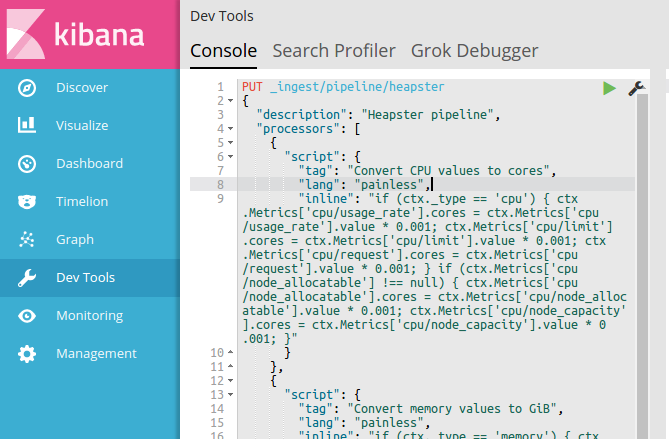
You can create the ingest pipeline from the Dev Tools console in Kibana. Just name your pipeline Heapster by hitting the PUT _ingest/pipeline/heapster endpoint with the heapster-pipeline.json document as payload:
Finally, we need to configure Heapster’s Elasticsearch sink to use our pipeline. Edit the Heapster Kubernetes deployment like we did before, and add a pipeline=heapster query parameter to the end of the --sink config:
spec:
    containers:
    -
      command:
        -  /heapster
        -  --source=kubernetes.summary_api:''
        -  --sink=elasticsearch:?nodes=https://[DB_HOST]:9243&esUserName=[DB_USER]&esUserSecret=[DB_PASS]&sniff=false&maxRetries=3&pipeline=heapster
Heapster will restart, and all new data will be transformed via our new ingest pipeline.
Mapping Heapster Data
By default, Elasticsearch creates data-type mappings dynamically. I learned the hard way that this can be more of a headache than a time-saver. If the first report of the day has your CPU usage at an even 3.0 cores, Elasticsearch will call that field a long. Any floating-point values ingested after that will result in mapping conflicts.
Mapping conflicts make that field unavailable for queries. And since resolving mapping conflicts is a real pain, we’re going to setup our mappings right off the bat. Lucky for you, I created a mapping template. If you want to create your own, just run GET /heapster*/_mapping to see the existing dynamically-created mappings and tweak it to your needs.
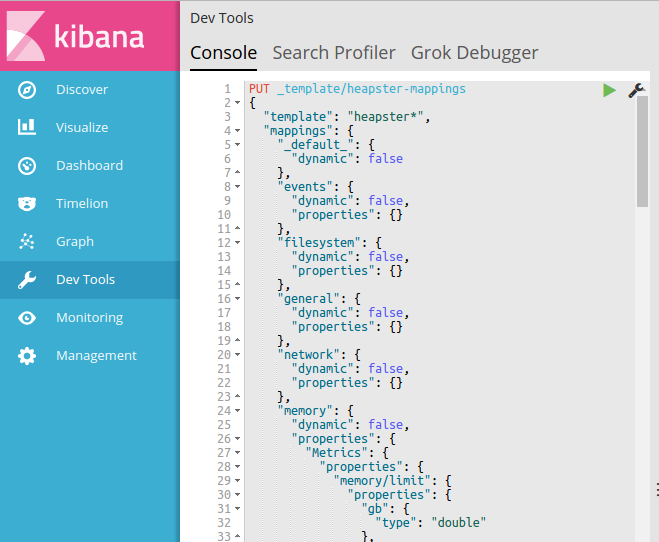
Once you have your template ready, send it as payload to PUT /_template/heapster-mappings
All new data from Heapster will use this template. To prevent any mapping conflicts with the old data, you’ll want to either reindex or just delete any old indexes:
DELETE /heapster*
Application Logs and Metrics
I won’t go too much into application logging, as this will be specific to your use case and environment. But we decided to send log data directly to Elasticsearch using Winston, a Node.js logger, rather than running Logstash or Fluentd to collect container logs. It just seemed a lot more straightforward for us.
If you do want to try collecting logs from your containers’ stdout, running a Fluentd DaemonSet seems like the way to go.
Visualizing with Kibana
It took a bit of playing around, but we’ve managed to create some nice dashboards in Kibana.
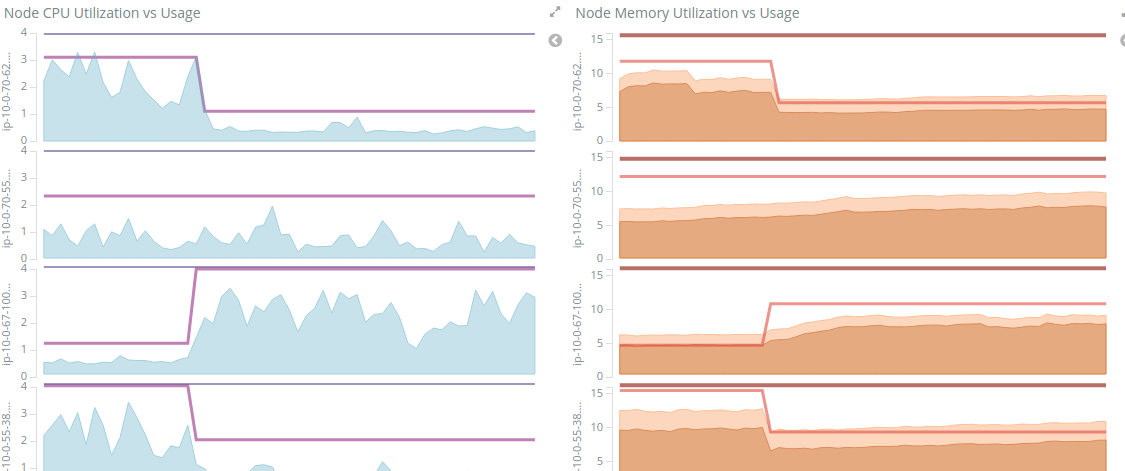
For example, the following are graphs showing node CPU/memory usage vs Kubernetes resource requests. You can see how pods were rescheduled during a recent deployment:
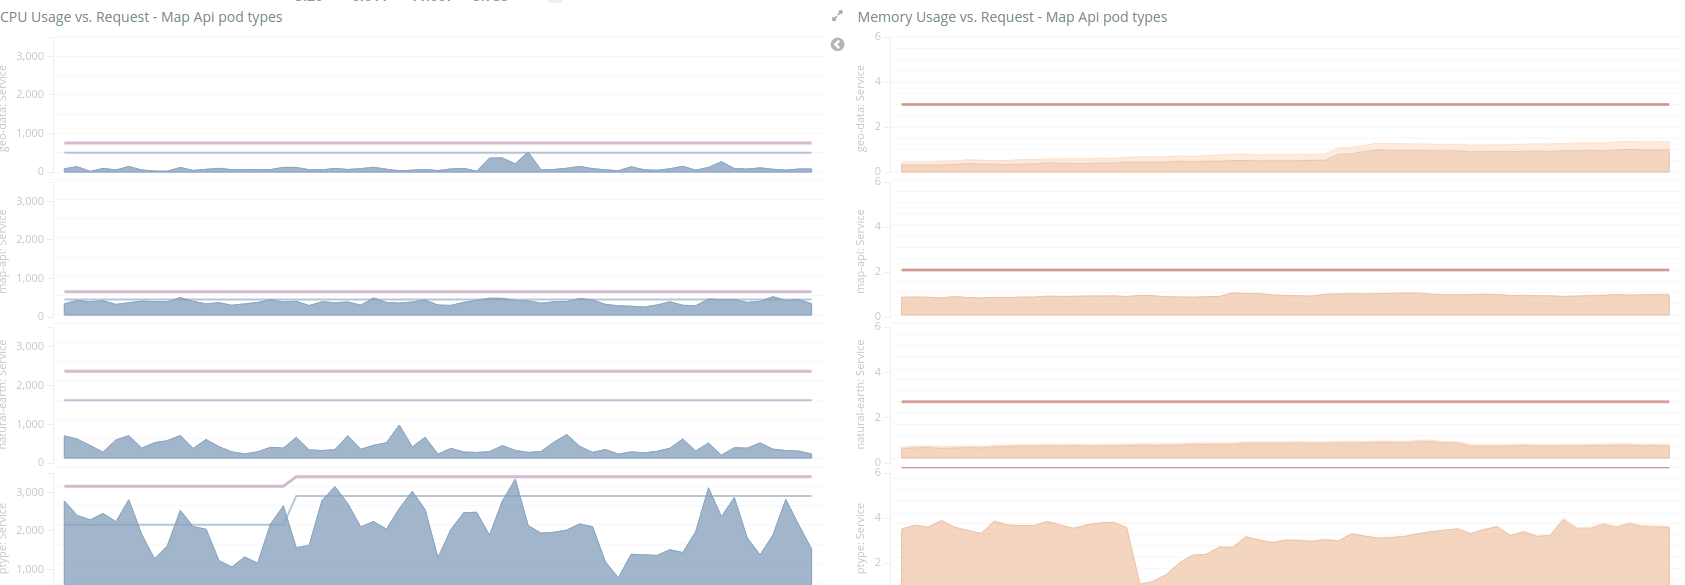
Because we parsed out the Kubernetes labels, we can also get CPU/memory usage graphs split by service type:
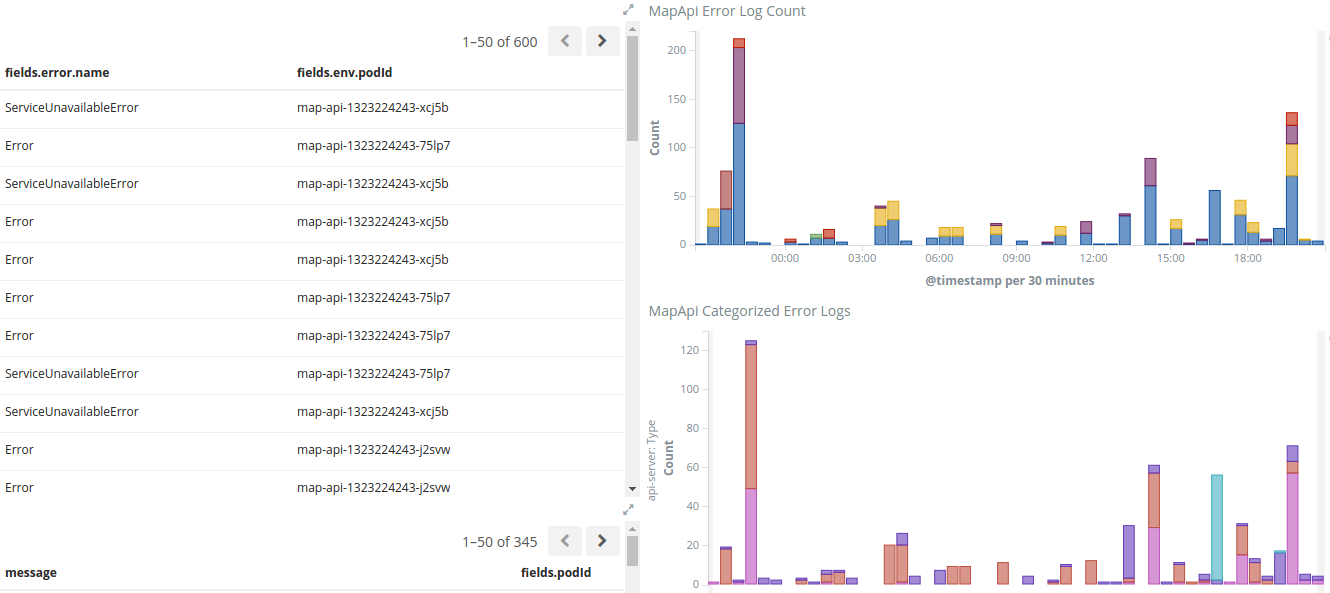
And here we have a list of application error logs right next to a chart of errors split by serviceId and error category:
Conclusions
With all of this data in Elasticsearch and Kibana, it makes it much easier to tell actionable stories about how our systems are behaving. So far, this information has allowed us to:
- Identify a number of optimizations in our system, and drastically reduce the error response rates of our AerisWeather Mapping Platform
- Tune our Kubernetes resource limits to better match actual usage, allowing us to scale down servers that weren’t being fully utilized
- Easily conduct A/B performance tests against new features, leading to major performance improvements
It took a bit of effort to get going, but the payoff was certainly worth the investment.