Observability with OpenTelemetry: Tracing vs Structured Logs
13 Feb 2024I recently worked at an organization that relied heavily on the “scream test” release methodology. If you’re not familiar, it goes something like this:
- Deploy code changes to production (preferably on a Friday afternoon)
- Check Slack every now and then, and see if anyone screams about things breaking
To be fair, this was a somewhat effective and certainly inexpensive strategy while the system was still limited to internal use. But as we began onboarding paying customers, the business started to recognize the downsides of the approach.
We had little observability into our system. That is to say, no one really knew how well production was performing, how often it failed, what types of errors our customers were seeing, or how code changes were affecting the system.
Addressing this challenge became a priority for my team. Having recently finished a terrific book on observability engineering, I came to believe that OpenTelemetry and related observability practices could give our engineering teams much better insight into our production systems. I was excited to give OpenTelemetry some hands-on consideration.
What is OpenTelemetry?
OpenTelemetry is an open-source specification and suite of tools for working with traces.
So what is a trace? I like to think of traces as structured logs + context:
- Structured Logs: System logs that are formatted as key-value attribute pairs (as opposed to arbitrary plain text)
- Context: Information tying pieces of log data together, to form a bigger picture. For example, a request ID could tie together all the log data for a single web request.
There is a lot that can be done with tracing, and it can intimidate starting out. In this blog post, I’ll show how standard logs may be “upgraded” to OpenTelemetry traces, and demonstrate some of the benefits of doing so. We’ll work through some real code examples using a web API server written in Go.
The full working code for these examples is available at github.com/eschwartz/otel-go-demo. We’ll use a free Honeycomb account to visualize traces, though many other vendors are supported.
Standard Logging
Consider this example of a web API endpoint written in Go, with some fairly standard logging:
func HandleGetItems(w http.ResponseWriter, r *http.Request) {
	log.Println("Received request to GET /items")

	// Parse query params for ?q=&limit=
	searchTerm := r.URL.Query().Get("q")
	limit := r.URL.Query().Get("limit")
	log.Printf("search term: %s, limit: %s", searchTerm, limit)

	// Execute DB query
	log.Println("Querying database....")
	items, err := dataService.FindItems(searchTerm, limit)
	if err != nil {
		log.Println("Database query failed! %s", err)
		w.WriteHeader(500)
		fmt.Fprintf(w, "Internal server error")
		return
	}
	log.Println("DB query complete! Found %d items", len(items))

	// Write JSON response
	err = json.NewEncoder(w).Encode(items)
	if err != nil {
		log.Printf("Failed to encode json: %s", err)
		w.WriteHeader(500)
		fmt.Fprintf(w, "Internal server error")
		return
	}

	w.WriteHeader(200)
	log.Println("Request to GET /items successful!")
}
The logging here is a good start towards observability, as it builds a nice story around what’s happening inside the system when a user makes a request:
Received request to GET /items
search term: bicycle, limit: 50
Querying database....
DB query complete! Found 23 items
Request to GET /items successful!
or maybe
Received request to GET /items
search term: bicycle, limit: 0
Querying database....
Database query failed! unexpected empty value
This is a great setup for local debugging. We can easily see every major operation that happens in a request, and identify scenarios where the system fails. But as we scale to thousands or millions of requests, we run into some problems:
- The logs are not easily searchable. We can
greplogs for certain values, but those values are likely to change over time, or across endpoints - We are not set up for analysis and visualization. For example, we may want to see a histogram counting the popularity of each search term. This would not be possible without some extra processing steps.
- Logs are lacking context. If we
grepfor logs containingDatabase query failed!, we lose important bits of information which may explain the error (like, thatlimit=0in the search query)
Structured Logs
Writing logs in a structured format (eg. JSON) will give us a lot more flexibility in querying and analyzing log data.
Structured logging is a midway step between plain-text logging and tracing. Let’s see how structured logging would look in our application, using the popular logrus library.
import (
	log "github.com/sirupsen/logrus"
)

func init() {
	// Configure logrus to output logs as JSON
	log.SetFormatter(&log.JSONFormatter{})
}
func HandleGetItems(w http.ResponseWriter, r *http.Request) {
	// Create a structured log with key-value attributes
	log.WithFields(log.Fields{
		"url": "/items",
		"method": "GET",
	}).Info("API Request")

	// Parse query params
	searchTerm := r.URL.Query().Get("q")
	limit := r.URL.Query().Get("limit")
	// Log query params
	log.WithFields(log.Fields{
		"searchTerm": searchTerm,
		"limit": limit,
	}).Info("Query params")

	// Execute DB query
	items, err := dataService.FindItems(searchTerm, limit)
	if err != nil {
		log.WithFields(log.Fields{
			"message": fmt.Sprintf("Database query failed! %s", err),
		}).Error("error")
		w.WriteHeader(500)
		fmt.Fprintf(w, "Internal server error")
		return
	}
	log.WithFields(log.Fields{
		"resultCount": len(items),
	}).Info("DB query")

	// Write JSON response
	err = json.NewEncoder(w).Encode(items)
	if err != nil {
		log.WithFields(log.Fields{
			"message": fmt.Sprintf("Failed to encode json: %s", err),
		}).Error("error")
		w.WriteHeader(500)
		fmt.Fprintf(w, "Internal server error")
		return
	}

	w.WriteHeader(200)
	log.WithFields(log.Fields{
		"method": "GET",
		"url": "/items",
		"statusCode": 200,
	}).Info("API Response")
}
Now our logs might look like:
{"url": "/items", "method": "GET", "msg": "API Request"}
{"searchTerm": "bicycle", "limit": 50, "msg": "Query params"}
{"resultCount":  23, "message":  "DB Query"}
{"url": "/items", "method": "GET", "statusCode": 200, "msg": "API Response"}
or maybe
{"url": "/items", "method": "GET", "msg": "API Request"}
{"searchTerm": "bicycle", "limit": 50, "msg": "Query params"}
{"error": "Database query failed! unexpected empty value", "msg": "Error"}
In this example, we could easily search for errors, or query parameters, or certain types of API requests using tools like jq or AWS CloudWatch Log Insights.
This is a big step up from unstructured logs, but we’re still missing a crucial piece: context.
Let’s say we’re searching through logs, and we see something like:
{ "msg": "Error":, "error": "Database query failed! unexpected empty value" }
On its own, this may or may not be useful. It requires that we guess at a lot of the context: what is the query that caused this error? what was the endpoint, and with what query params? In a complex system, these bits of contextual information may be critical in debugging the error.
Tracing with OpenTelemetry
Let’s see how OpenTelemetry adds context to structured logs:
OpenTelemetry requires some configuration to get running. See the full example code at github.com/eschwartz/otel-go-demo
// Create an OpenTelemetry (otel) tracer
var tracer = otel.Tracer("example.app")

func HandleGetItems(w http.ResponseWriter, r *http.Request) {
	// Start a new trace, creating a "parent span"
	// This span will describe the entire GET /items request
	_, span := tracer.Start(context.Background(), "GET /items")
	defer span.End()

	// Add attributes to the span (similar to structured log values)
	span.SetAttributes(
		// We'll use the `app.` prefix to distinguish these values
		// from other instrumented attributes
		attribute.String("app.url", "/items"),
		attribute.String("app.method", "GET"),
	)

	// Parse query params
	searchTerm := r.URL.Query().Get("q")
	limit := r.URL.Query().Get("limit")

	// As we continue processing the request,
	// we'll keep adding attributes to the span
	limitInt, _ := strconv.Atoi(limit)
	span.SetAttributes(
		attribute.String("app.searchTerm", searchTerm),
		attribute.Int("app.limit", limitInt),
	)

	// Execute DB query
	items, err := dataService.FindItems(searchTerm, limitInt)
	if err != nil {
		// Errors are just another attribute of the span!
		span.SetAttributes(
			attribute.String("app.error", fmt.Sprintf("Database query failed! %s", err)),
			attribute.Int("app.response.status", 500),
		)
		w.WriteHeader(500)
		fmt.Fprintf(w, "Internal server error")
		return
	}

	span.SetAttributes(
		attribute.Int("app.resultCount", len(items)),
	)

	// Write JSON response
	w.WriteHeader(200)
	err = json.NewEncoder(w).Encode(items)
	if err != nil {
		span.SetAttributes(
			attribute.String("error", fmt.Sprintf("Failed to encode json: %s", err)),
			attribute.Int("response.status", 500),
		)
		w.WriteHeader(500)
		fmt.Fprintf(w, "Internal server error")
		return
	}

	span.SetAttributes(
		attribute.Int("response.status", 200),
	)
}
If we configure OpenTelemetry to export traces to a Honeycomb backend, we’ll see each trace event in Honeycomb:
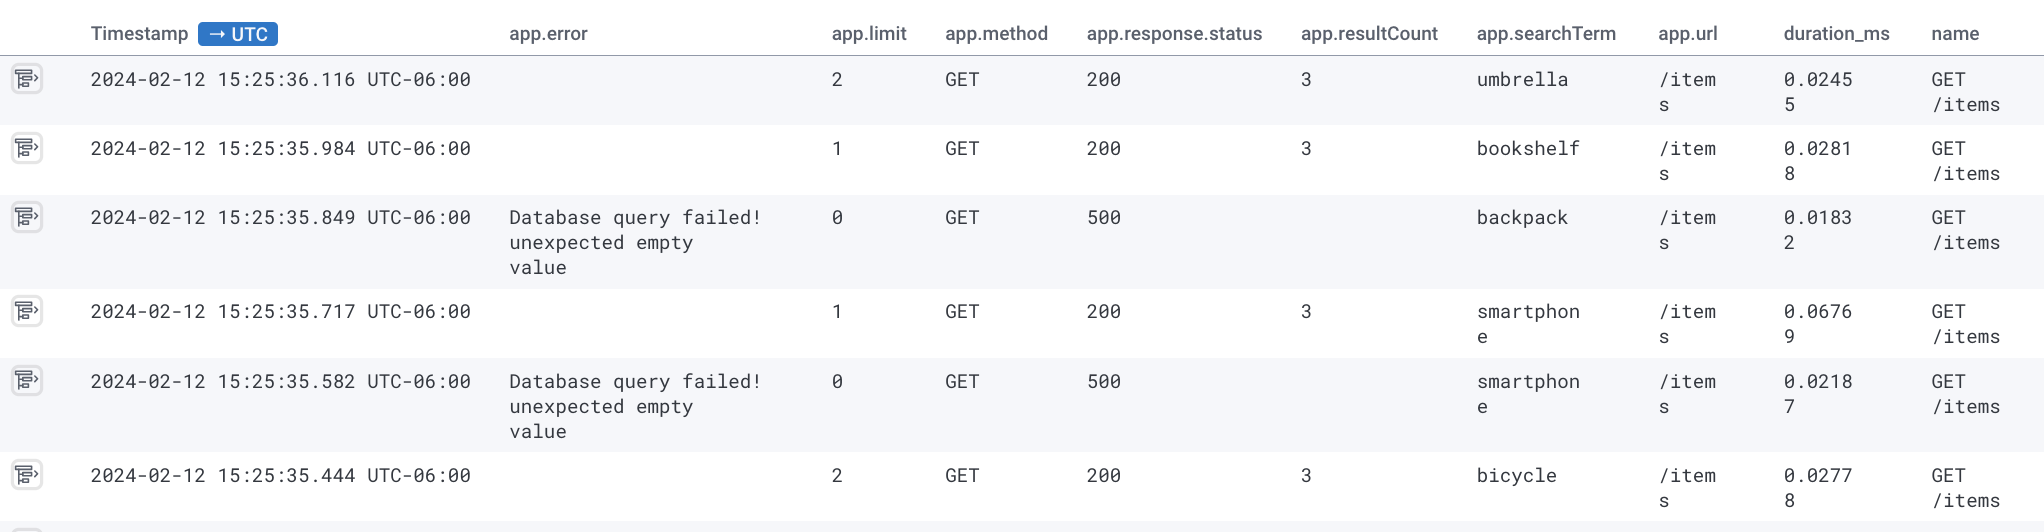
This looks a lot like structured logging! The big difference so far is that with structured logging, we would instead have multiple separate logs for this one request.
But with tracing, we wrap up all the information about the request into a single trace. This gives every data point some context: we know which request it belongs to, and we have a rich set of data describing the request. In this example, we can clearly see that failing requests all have app.limit = 0.
Bubble Up
But what happens when we have thousands or millions of requests to filter through, and when each request contains a wide set of attributes?
The Bubble Up tool from Honeycomb can help us here. If we select a certain condition – say, when a request has an error – Honeycomb will attempt to find correlations between that selected condition and any other trace attributes.
Here we see that the app.error condition occurs most often when app.limit = 0:
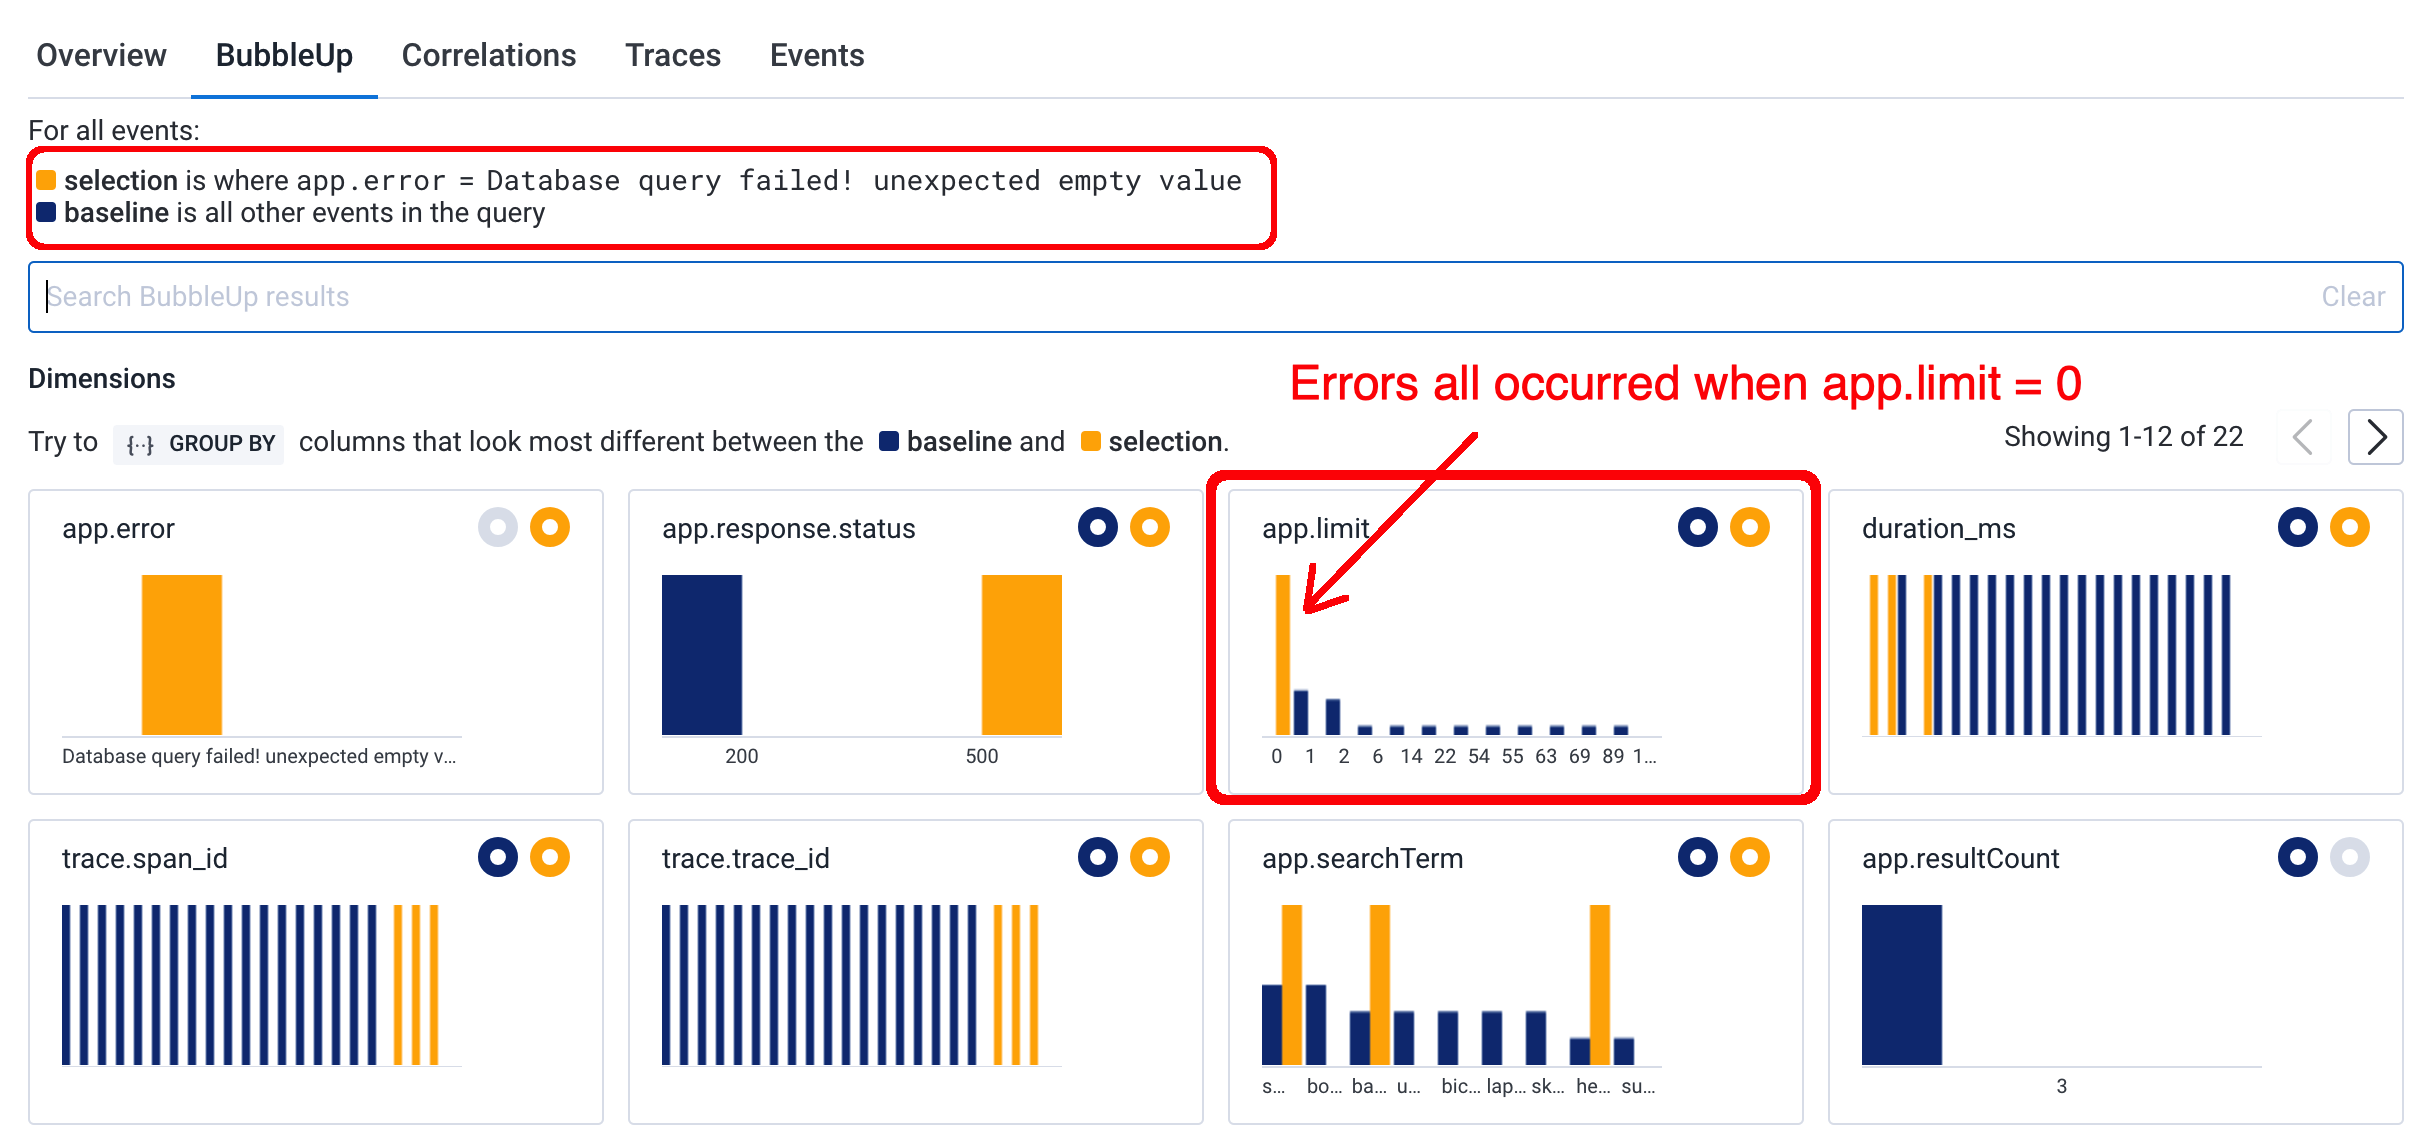
This is an incredibly powerful tool for digging into application issues.
Child Spans
Having a trace with a single span may be sufficient for basic use cases. But often we’ll want to use nested child spans to “trace” the code path across multiple operations. In this example, we’ll create a child span to track the data service operation. This may help us figure out why certain requests are so slow!
The OpenTelemetry (otel) SDK for Go uses context to generate child spans from parents. Here, we’ll pass a ctx argument to the data service, so it can create a child span:
func HandleGetItems(w http.ResponseWriter, r *http.Request) {
  // Start a new trace, creating a "parent span"
  // We'll use the `ctx` return value to pass this span to other methods
  ctx, span := tracer.Start(context.Background(), "GET /items")

  // ...process query params, etc

  // As we execute the DB query, we'll pass the span `ctx` to
  // the FindItems() method, so it can create its own chlid span
  items, err := dataService.FindItems(searchTerm, limitInt, ctx)

  // ...generate response
}
// Inside the `dataService.FindItems()` method...
func (svc *DataService) FindItems(term string, limit int, ctx context.Context) ([]Item, error) {
  // Create a child span, using the provided context argument
  _, span := tracer.Start(ctx, "DataService.FindItems")
  defer span.End()

  // You may attach additional attributes to this child span, if it's useful

  // ...etc
}
NOTE: many 3rd party libraries have built-in OTEL support, and will generate child spans with useful information. See, for example, the AWS SDK will automatically create a child span for each API call.
We can now visualize the trace as a tree honeycomb:
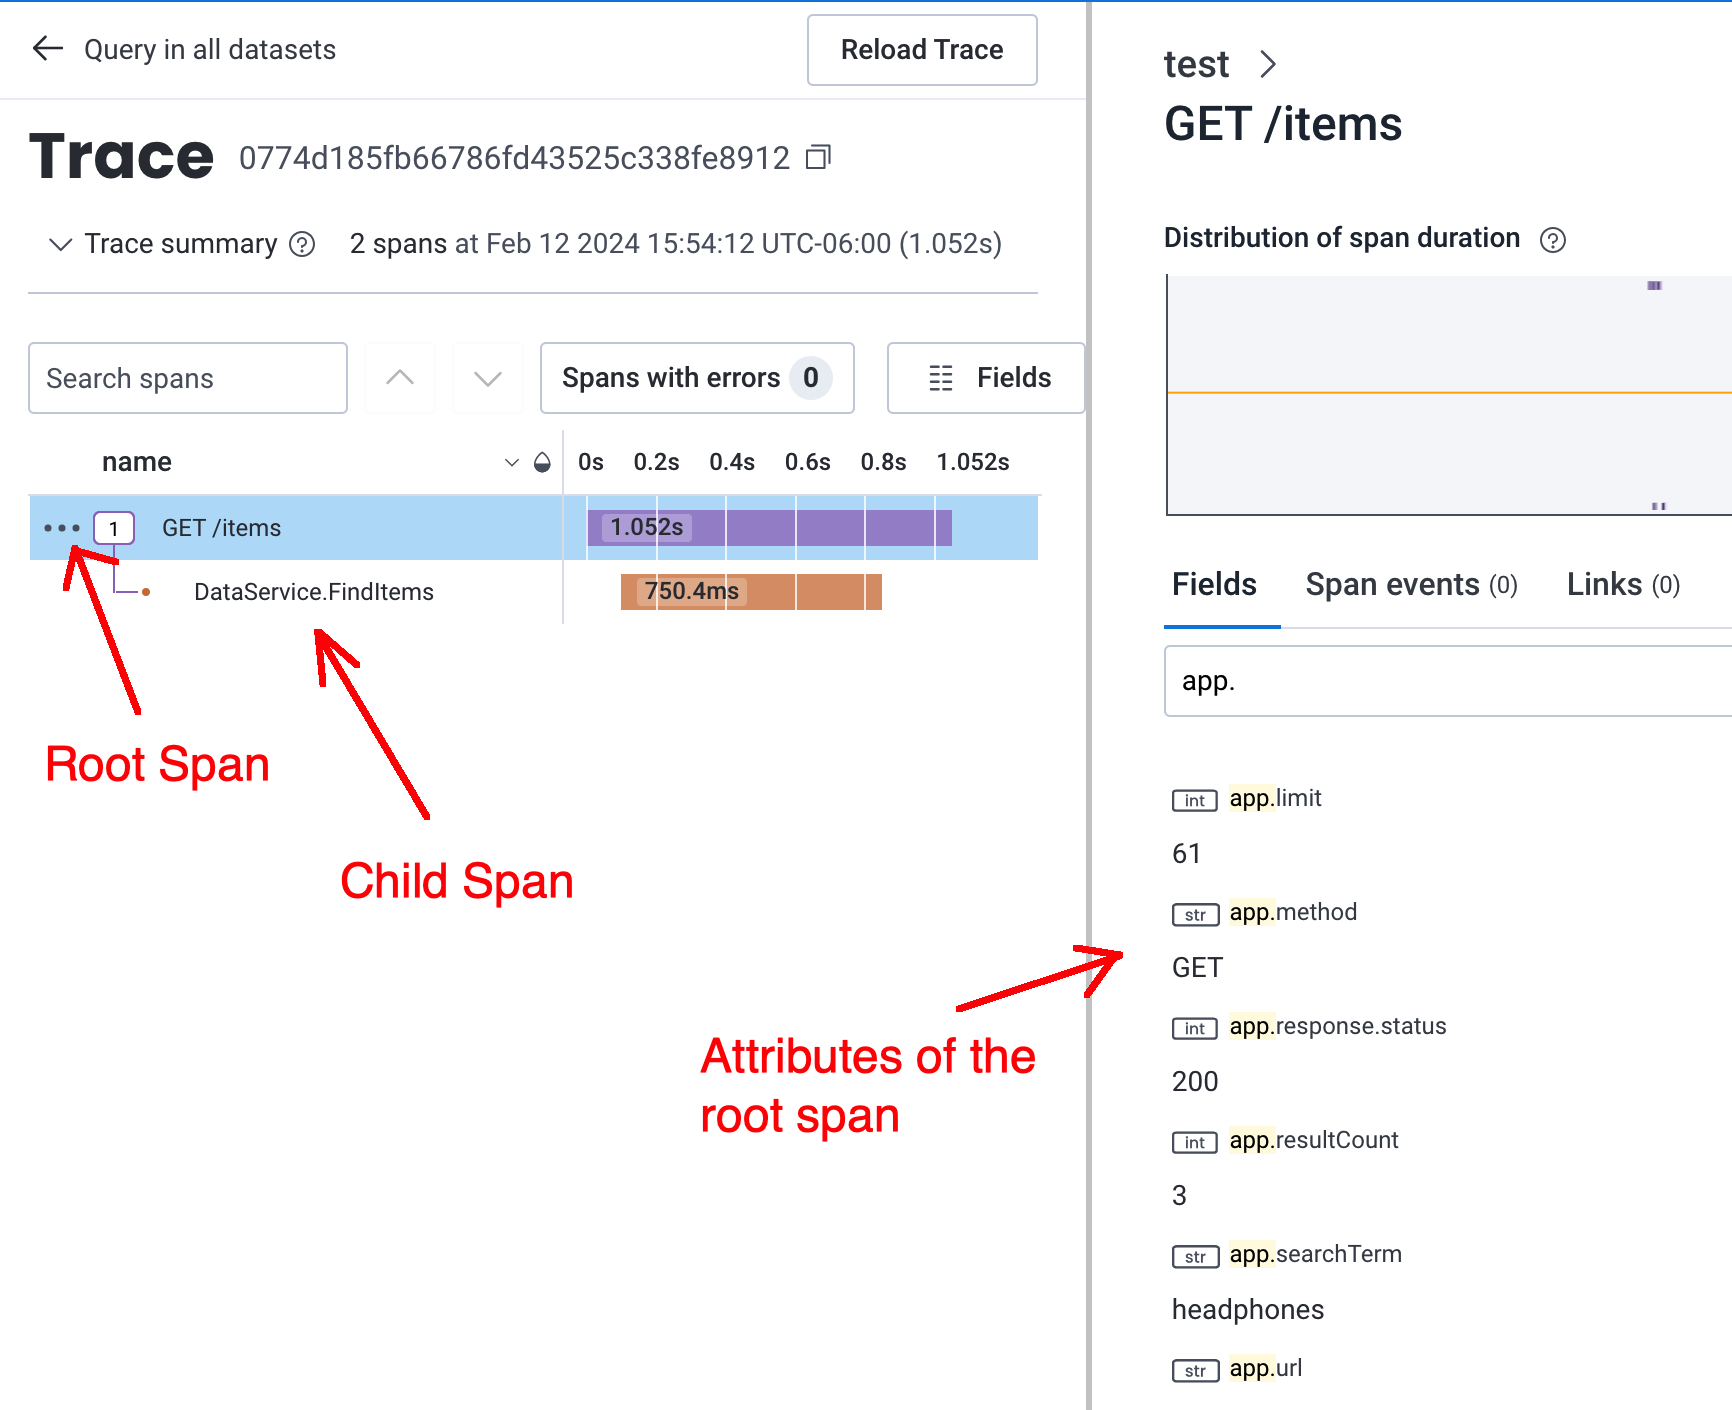
Traces have timing information built in, so we can see here that the data service is causing much of the latency in this particular request.
Let’s use Honeycomb’s Bubble Up feature again to see if we can find what’s causing the slow performance:
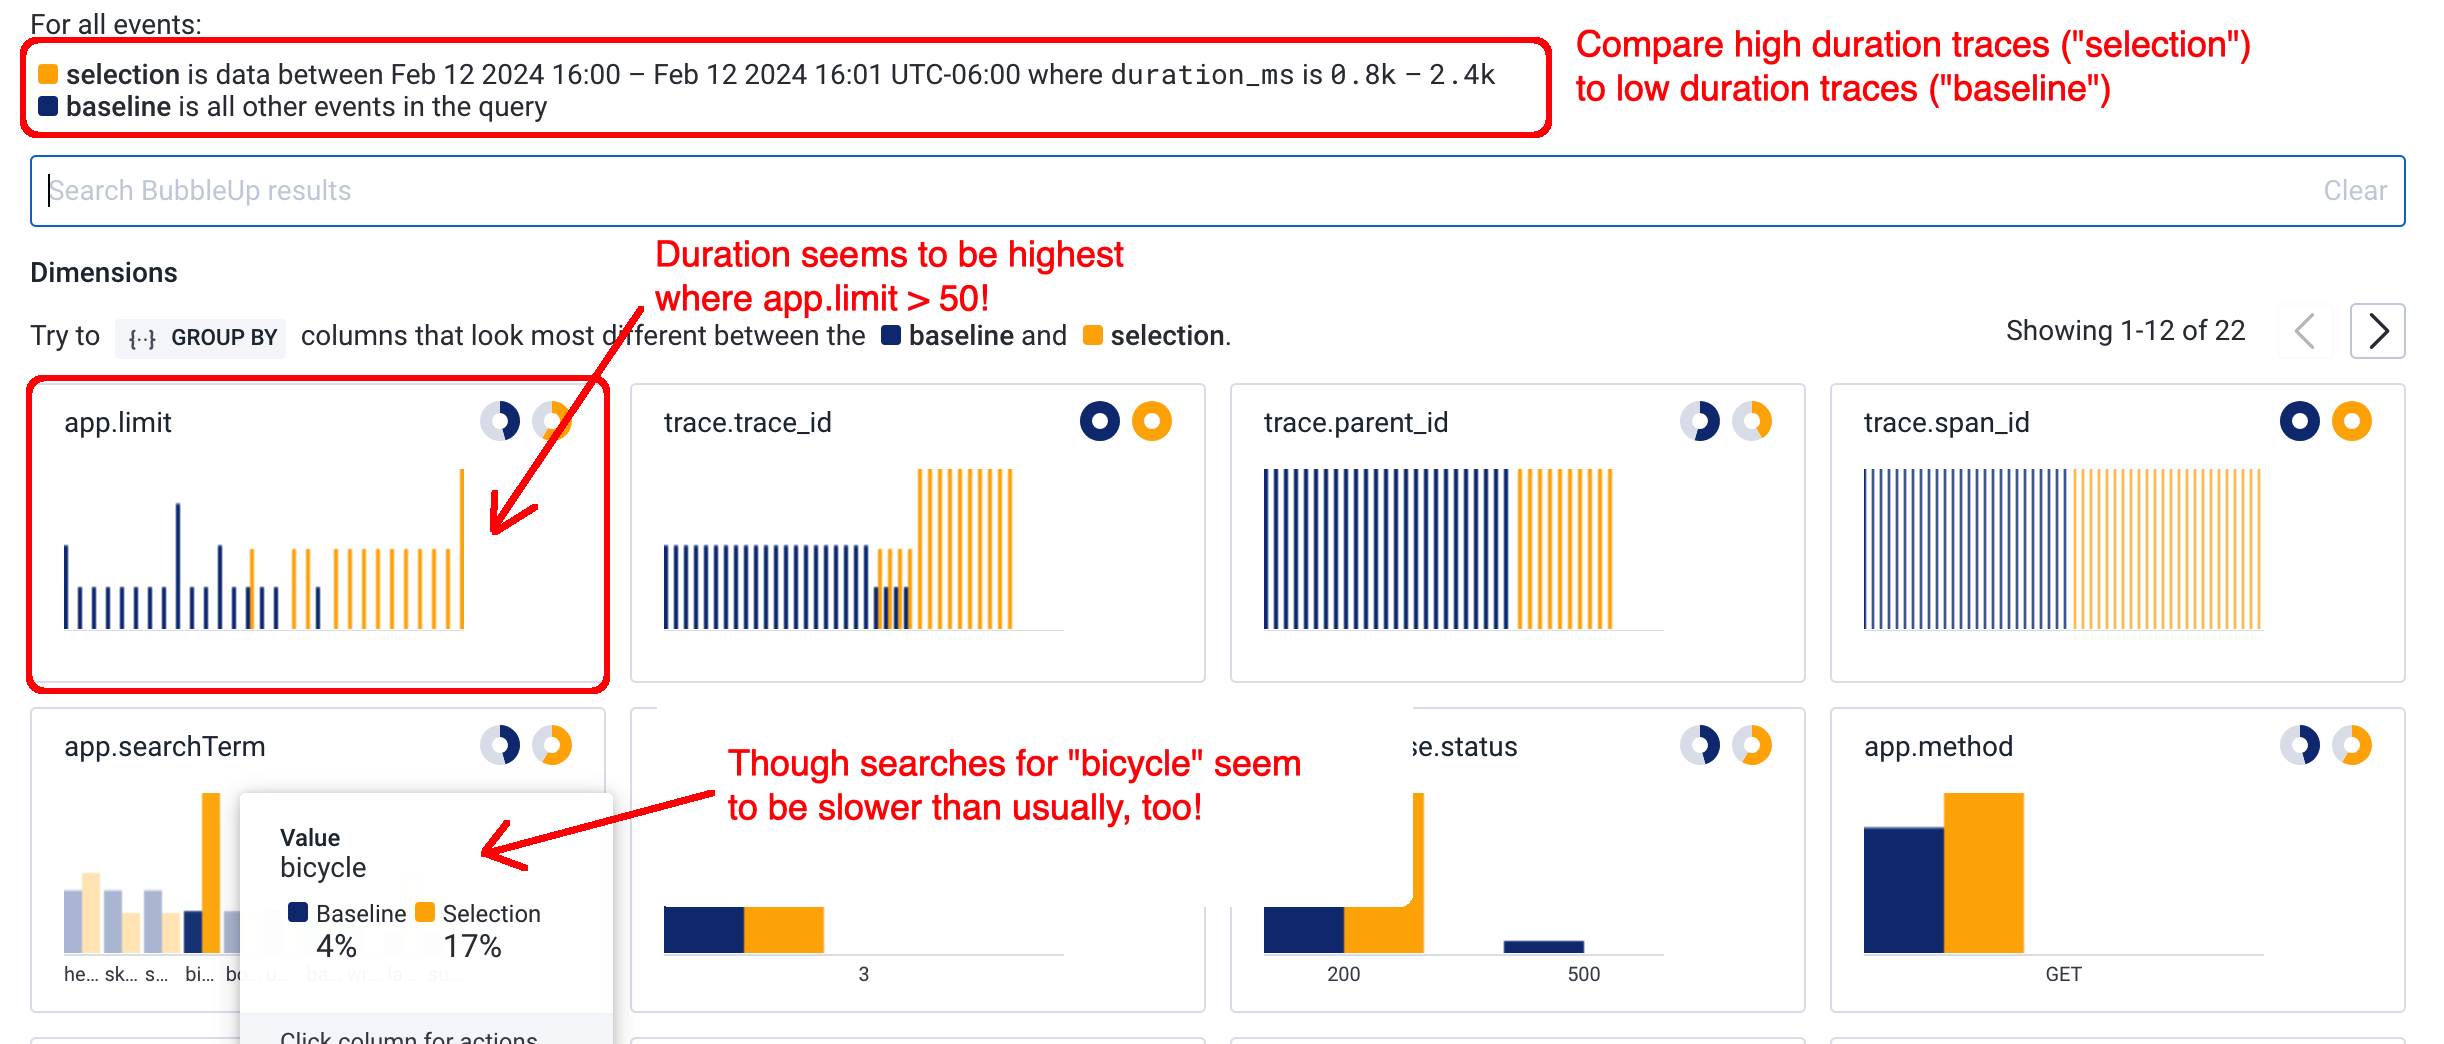
We can see here there’s a strong correlation between latency and the app.limit attribute. This is something we’ll have to address!
I’ve found this Bubble Up tool to be incredibly powerful in tracking down hard-to-find issues. This is especially true if your app is instrumented with a rich set of attributes on each span, so that unexpected correlations can rise out of the woodwork.
Takeaways
Jumping into OpenTelemetry can feel like a daunting endeavor. When I started looking into OpenTelemetry, I found myself incredibly lost just trying to figure out all these new terms and concepts: traces, spans, collectors, propagation, baggage, etc. And on top of that, tracing introduces some radical paradigm shifts in how we approach logging and observability.
But at its most basic level, OpenTelemetry is really just structured logs + context – concepts that many of us are already familiar with. Framing it in this way, OpenTelemetry might feel more accessible to you and your engineering team.
Next: Distributed Tracing with OpenTelemetry
Structured logs with context are powerful in their own right, especially when combined with tooling like Bubble Up. But where OpenTelemetry really shines is in distributed tracing. Imagine traces that contain information about the entire request, from the client side, to APIs, to backend microservices, and so on.
This post is meant as a basic introduction to observability with OpenTelemetry. In my next posts, I will discuss how to set up distributed tracing, including some edge cases which will require custom tooling.