Observability with OpenTelemetry: Trace Propagation Between Services
22 Feb 2024In my last post about Observability with OpenTelemetry, we explored the basic components of OpenTelemetry – traces, spans, attributes – and considered tracing as a way to add context to structured logs. If you are not already familiar with the basic concepts of OpenTelemetry, I highly recommend you go back and check out that post.
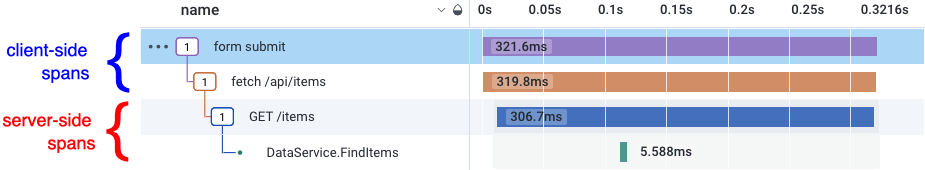
Today, we’ll explore how OpenTelemetry can be used to trace requests across service boundaries. Specifically, we’ll see how traces can begin in a client-side web app (JavaScript) and continue through to an API backend (Go). When we’re done, we’ll have a trace that looks something like this:
To get there, we’ll start by exploring the JavaScript Browser SDK for OpenTelemetry. Then we’ll see how we can instrument the JS Fetch API to send our trace context over HTTP to our Go API server.
The full working code for these examples is available at github.com/eschwartz/otel-go-demo. We’ll use a free Honeycomb account to visualize traces, though many other vendors support OpenTelemetry.
OpenTelemetry in the Browser
The OpenTelemetry SDK for JavaScript is available as a set of npm packages. A bit of setup is required before we can start writing traces. This setup is covered in more detail in the OpenTelemetry docs, but the key thing you’ll see is that we configure an exporter to send our traces to Honeycomb.
If you’re using Jaeger, an OTEL Collector, or another backend, you will need to modify the exporter config accordingly.
// Adapted from https://opentelemetry.io/docs/languages/js/getting-started/browser/
import {
    SimpleSpanProcessor,
    WebTracerProvider
} from '@opentelemetry/sdk-trace-web';
import { ZoneContextManager } from '@opentelemetry/context-zone';
import {OTLPTraceExporter} from "@opentelemetry/exporter-trace-otlp-http";
import {Resource} from "@opentelemetry/resources";

// The tracer provider holds top-level configuration for tracing in this app
const provider = new WebTracerProvider({
    resource: new Resource({
        // This service name is used as the dataset in Honeycomb
        "service.name": 'test',
    }),
});

// Configure the exporter to send traces to the Honeycomb API
const exporter = new OTLPTraceExporter({
    url: "https://api.honeycomb.io/v1/traces", // US instance
    headers: {
        // NOTE: As this is running client side, this key will be exposed to end users
        // A better alternative may be to run an otel collector on the same server
        "x-honeycomb-team": "<your Honeycomb API key>",
    },
})
// The SimpleSpanProcess will send spans as soon as they're ready
// Alternatively, you can use a BatchSpanProcessor, which will send spans in batches
provider.addSpanProcessor(new SimpleSpanProcessor(exporter));

// We need to use the ZoneContextManager() to suppor async operations
provider.register({
    contextManager: new ZoneContextManager(),
});
With this boilerplate configuration out of the way, we’re now ready to create OpenTelemetry traces in the browser.
Creating Traces in JavaScript
Let’s start by sending an HTTP request to the Go web server that we created in our previous post:
async function fetchItems(q, limit) {
    const res = await fetch(`/api/items?q=${q}&limit=${limit}`)
    const items = await res.json()

    return items
}
We can create a trace for this fetch() operation using the tracer.startActiveSpan() method from the @opentelemetry/api package:
import {trace} from "@opentelemetry/api";

// To create traces, we first need to create a tracer
let tracer = trace.getTracer('app-tracer');

async function fetchItems(q, limit) {
    // Create a new trace span
    return tracer.startActiveSpan('fetch /api/items', async span => {
        // Add attributes to the span, however we wish
        span.setAttributes({
            'app.request.q': q,
            'app.request.limit': limit,
        })

        // Send the HTTP request to the server
        const res = await fetch(`/api/items?q=${q}&limit=${limit}`)
        const items = await res.json()

        // Update the span with more attributes from the response
        span.setAttributes({
            'app.response.count': items.length,
            'app.response.status': res.status,
        })

        // Send the trace to Honeycomb
        span.end()

        return items;
    })
}
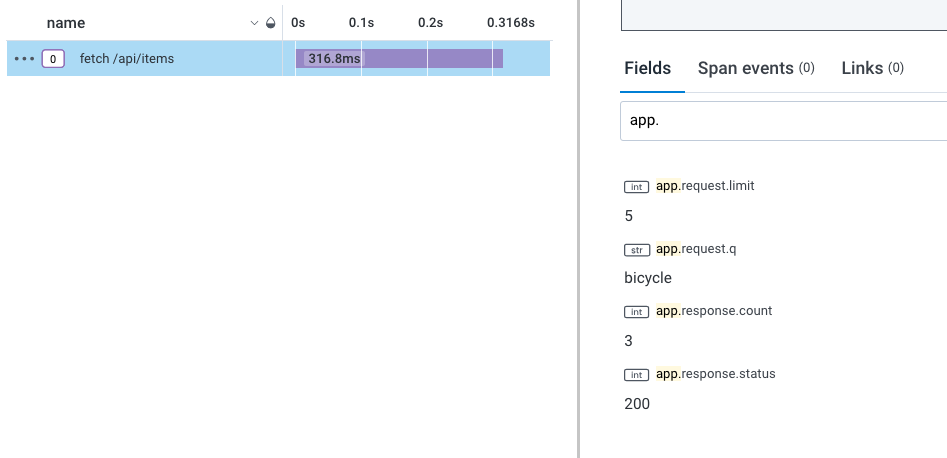
This will give us a trace with a single span named fetch /api/items, with a few attributes describing the request:
Error Handling in Traces
Careful readers may notice a potential issue with our code: we are missing some important error handling. If fetch() or res.json() throw an error, the function will exit before span.end() is called, and our span will be lost. Let’s add some proper error handling to this request, to ensure that spans always make it to Honeycomb:
async function fetchItems(q, limit) {
    return tracer.startActiveSpan('fetch /api/items', async span => {
        // use try/catch to handle errors
        try {
            span.setAttributes({
                'app.request.q': q,
                'app.request.limit': limit,
            })

            // Fetch the items
            const res = await fetch(`/api/items?q=${q}&limit=${limit}`)

            // Check for HTTP error codes
            if (res.status >=400) {
                // Include the server response in our error span
                span.setAttribute(`app.response.body`, await res.text())
                throw new Error(`Unexpected HTTP ${res.status} response`)
            }

            const items = await res.json()

            span.setAttributes({
                'app.response.count': items.length,
                'app.response.status': res.status,
            })

            return items
        }
        catch (err) {
            // If anything above fails, catch the error and update the span
            // with relevant information about the error
            span.setStatus({ code: SpanStatusCode.ERROR, message: err.message });
            span.setAttributes({
                "app.error": err.message,
            })
            throw err
        }
        finally {
            // Send the trace to Honeycomb, whether or not the operation succeeded
            span.end()
        }
    })
}
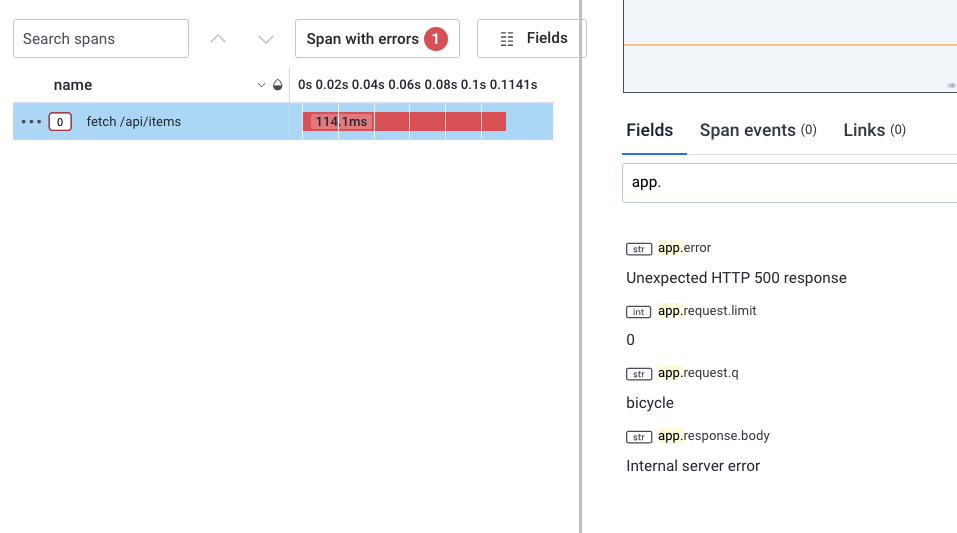
Now we’ll see some proper error information in our trace in Honeycomb:
A Helper Method for Tracing
The try/catch/finally logic we added to our tracing operation will be necessary any time we create a new span. Rather than write this out every time (or worse, forget to handle errors at all!), we can come up with a helper method to wrap any function that we want to be traced:
// Wrapper around tracer.startActiveSpan()
// with added support for error handling and sending the span.
const withActiveSpan = (name, fn) => {
    return tracer.startActiveSpan(name, async span => {
        try {
            // Attempt to execute the core operation
            return await fn(span)
        }
        catch (err) {
            // Handle operation errors by updating the span with error info
            span.setStatus({ code: SpanStatusCode.ERROR, message: err.message });
            span.setAttributes({
                "app.error": err.message,
            })
            throw err
        }
        finally {
            // Send the span to Honeycomb, whether or not the core operation succeeded
            span.end()
        }
    })
}
Using this helper method, our fetchItems() function no longer needs to include explicit error handling:
async function fetchItems(q, limit) {
    // Create a new trace span
    return withActiveSpan('fetch /api/items', async span => {
        // Add attributes to the span
        span.setAttributes({
            'app.request.q': q,
            'app.request.limit': limit,
        })

        // Fetch the items
        const res = await fetch(`/api/items?q=${q}&limit=${limit}`)

        // Handle HTTP error codes
        if (res.status >=400) {
            span.setAttribute(`app.response.body`, await res.text())
            throw new Error(`Unexpected HTTP ${res.status} response`)
        }

        // Deserialize JSON response
        const items = await res.json()

        // Update the span with more attributes from the response
        span.setAttributes({
            'app.response.count': items.length,
            'app.response.status': res.status,
        })

        return items
    })
}
Child Spans
Just like in our Go web server, our JavaScript client may create nested child spans. This works a little bit different in JavaScript than in Go, as we don’t need to explicitly connect the parent span to the child span. If an “active” span exists, any newly created span will become the child of that active trace:
withActiveSpan('parent', () => {
    withActiveSpan('child', () => {
        // This span is automatically made to be a child of the parent span
    })
})
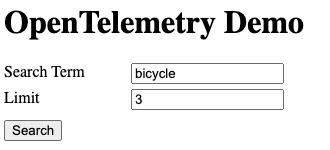
Let’s apply this to our web app. When fetching items from the server, we may want to know which UI event triggered the request. In this example, we’ll use a basic HTML form to trigger a fetch() request:
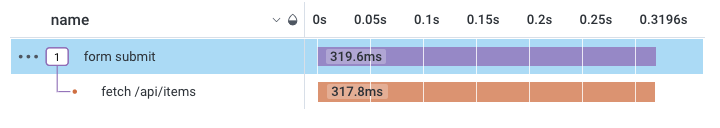
When that form is submitted, we’ll create a "form submit" span to track that UI event:
// Handle form submissions
document.getElementById("search").onsubmit = async (evt) => {
    // Prevents a page reload on form submit
    evt.preventDefault()

    // Create a new span to track the form submission
    withActiveSpan("form submit", async span => {
        const limit = document.getElementById("limit").value
        const q = document.getElementById("term").value

        // We could add attributes to the span here, if we'd like

        // Trigger the HTTP request to the server
        // Inside fetchItems(), we create a "fetch /api/items" child span
        let items = await fetchItems(q, limit)

        // Render the items
        document.getElementById("items")
            .innerHTML = items.map(item => `<li>${item.value}</li>`).join('')
    })
}
When we call fetchItems(), we create a new "fetch /api/items" span. This span
is automatically assigned to be a child of the "form submit" span.
We can see how this works out in Honeycomb:
Propagating Traces
You may remember that our Go web server creates its own trace when receiving HTTP requests to the GET /items endpoint:
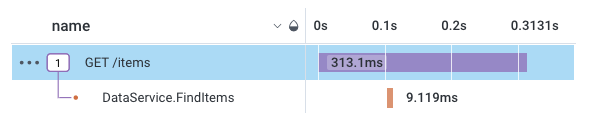
So now we have two separate traces, but really only one user operation. What we actually want is to continue, or propagate, the trace from the client through to the server. So when we’re talking about trace propagation, we’re really talking about joining together the client-side trace with the server-side trace.
The way we’ll do this is to pass the trace ID and span ID to the server, as part of our HTTP request. This will allow spans created on the server to set that span ID from the client as their parent span. The standard way to pass the trace ID and span ID is to use a traceparent request header. This header will look something like this:

As you can see, this header is made up of:
- A traceparent version, which indicates which version of the spec we are using. Until they change the spec, this will always be
00 - The ID of the active trace
- The ID of the active span
- Trace flags, which may indicate some metadata about the trace. For our case, this will always be
01.
Let’s update our JavaScript code to include this traceparent header
// Fetch the items
const res = await fetch(`/api/items?q=${q}&limit=${limit}`, {
    headers: {
        // Propagate our trace via an HTTP header
        traceparent: `00-${span.spanContext().traceId}-${span.spanContext().spanId}-01`,
    }
})
Server-side, this header is picked by the go.opentelemetry.io/otel library. All we need is this one line of configuration for the trace to propagate:
otel.SetTextMapPropagator(propagation.TraceContext{})
The full otel setup code is available at github.com/eschwartz/otel-go-demo
With this traceparent header in place, we now have a complete trace that starts at the client (JavaScript) and continues on to the server (Go):
To the server …and beyond!
In this post we worked through a simple example of trace propagation just to give you a feel for how traces can span service boundaries. If you’re working in a microservice-heavy environment, you might imagine how this could be applied so that a single trace would contain multiple hops between microservices.
In a previous post, we considered the idea of tracing as structured logs with context. Trace propagation supercharges the context of your logs by connecting the dots between various services. Sometimes it’s not enough, for example, to know that a database query failed. You might need to know which event in which front-end view triggered the API request that led to the database query. All of this is possible with propagated tracing.